In the era of smarter smart phones and sophisticated mobile hardware specs like dual core processor , 800 MB of RAM and operating systems like iOS or Android or may be WP 7 depending on the maker and device limitations, yet majority of mobile devices in the enterprise world like distribution, retail and logistics are using a Pocket PC (PPC) or a Windows Mobile (WM) based devices some even use devices running on Windows CE, mostly because of the special auxiliaries such as inbuilt laser scanner ,camera and phone, resulting which we have the heavy duty smart devices like the Motorola MC 70 or the MC 17 ,Such devices generally come with minimal resources or computing capacity available, the specifications like generally like CPU - Intel PXA270; 32 bit; 520 MHz or a ARM ,Memory - 64 MB RAM; 64 MB Flash ROM
OS - Microsoft Windows CE 5.0 Professional Version, hence the application performance plays a pivotal role operationally, for the developers it's a real challenge to code efficiently on the .Net Compact framework which is a compact version of the full .net framework, resulting in limited support for features like the garbage collection and the UI dispositions, some respite for developers is that with CF 3.5 we get to use WCF and some C# 3 language support like the LINQ , auto-property and so on.
Even with the best of practices and architectural design put in place whilst development or before the development there would certainly be lots to learn by the time we have the first piece of code running on the device, implies that design is a evolving process in mobile development at least in this case, we would have to continually monitor performance based on certain classification so that we are focused in our approach, the performance of the device could be classified as follows

AM - Often relates to OOM [Out Of Memory] exceptions, mostly due a weak GC and no support for bitmap compression in compact framework. hence it the bitmaps and controls has to be cautiously used and disposed off when the job is done.
CU - Relates to the battery life as per laws of performance CPU usage is directly proportional to the the battery life and hence this counter becomes even more critical after memory.
BL - again theory of relativity the battery life is directly proportional to the read write and CPU usage.
PT- Time taken in screen transitions in case of a complex forms application, this metrics is very specific to the way we instantiate and load objects throughout our application.In addition to the process time the read write on the log files must be optimized so that we don't use unnecessary read/write cycles which is a expensive operation , instead of doing a instant write on the log file have it in buffer up to certain limit and than write it on the log file by doing this we can optimize read/write.
The best way to monitor performance is by having resource specific counters on the device , compact framework ships with tools like RPM , lets have a look at how we get these counters ticking.
Monitoring Counters
How would you find out that whether there is a leak in memory or pinned object count , monitor CG counters when the application in running on the device ?
The best way to monitor these counters is to use the Remote Process Monitor RPM and hook it up with the process monitor (Processmon) , follow the below steps to configure the RPM and counters to hook it to your device.
Step 0 : Connect the device to your dev box, through active sync or TCP.
Step 1 : Make sure the executable is available in the following location "C:\Program Files\Microsoft.NET\SDK\CompactFramework\v3.5\bin\NetCFRPM.exe"
I personally prefer the earlier version of RPM which does not crash like the later "C:\Program Files\Microsoft.NET\SDK\CompactFramework\v2.0\bin\NetCFRPM.exe" and hence would continue the show using v2.0 , the option are pretty much the same , feel that 2.0 is more stable than 3.5 RPM.
Note C:\ => Change the drive letter to the one you have installed it on.
Step 2 : Copy the files netcflaunch.exe & netcfrtl.dll from location "C:\Program Files\Microsoft.NET\SDK\CompactFramework\v2.0\WindowsCE\wce500\armv4i" on to the Windows directory of the device (my case it is a ARM, take the files from mipsiv if its a MIP based as all types are available)
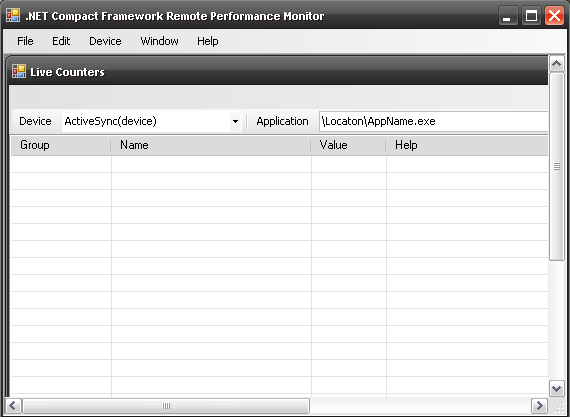
Step 3 : Run the exe and add live counter by clicking on Live counters as shown below

Step 4 : Connect to the device and specify the location and name of the exe and connect , make sure the application is currently not running on the device as the RPM will automatically invoke the exe specified (as by default launch on connect option will be enabled).
Step 5 : Make sure the below shown option are selected for the RPM to publish the metrics to the process monitor

Step 6 : To save a stat of log file make sure the options are selected from the device menu , so that
the artifacts can be used to compare the counters after making any performance tuning.

Step 7 : Now open the performance monitor (Win Key + R -> type -> perfmon - > enter) and add the necessary counters as shown below

Once you have done all the above settings , now you are ready will all required ammunition to have a crack at the performance of your application in the device, as a result of this exercise you will have the performance graphs as well as the RPM counters which looks like this


The reports should give you a clear idea about memory , windows forms and GC details in depth which would help in identifying any bottleneck in the application , running many runs with different set of data and analyzing the data would give a clearer picture on the performance. hope this post helps you in setting up RPM and set the performance monitoring rolling. more on the counters and performance tuning best practices will follow in the future posts on the same topic. until then happy profiling.
OS - Microsoft Windows CE 5.0 Professional Version, hence the application performance plays a pivotal role operationally, for the developers it's a real challenge to code efficiently on the .Net Compact framework which is a compact version of the full .net framework, resulting in limited support for features like the garbage collection and the UI dispositions, some respite for developers is that with CF 3.5 we get to use WCF and some C# 3 language support like the LINQ , auto-property and so on.
Even with the best of practices and architectural design put in place whilst development or before the development there would certainly be lots to learn by the time we have the first piece of code running on the device, implies that design is a evolving process in mobile development at least in this case, we would have to continually monitor performance based on certain classification so that we are focused in our approach, the performance of the device could be classified as follows

AM - Often relates to OOM [Out Of Memory] exceptions, mostly due a weak GC and no support for bitmap compression in compact framework. hence it the bitmaps and controls has to be cautiously used and disposed off when the job is done.
CU - Relates to the battery life as per laws of performance CPU usage is directly proportional to the the battery life and hence this counter becomes even more critical after memory.
BL - again theory of relativity the battery life is directly proportional to the read write and CPU usage.
PT- Time taken in screen transitions in case of a complex forms application, this metrics is very specific to the way we instantiate and load objects throughout our application.In addition to the process time the read write on the log files must be optimized so that we don't use unnecessary read/write cycles which is a expensive operation , instead of doing a instant write on the log file have it in buffer up to certain limit and than write it on the log file by doing this we can optimize read/write.
The best way to monitor performance is by having resource specific counters on the device , compact framework ships with tools like RPM , lets have a look at how we get these counters ticking.
Monitoring Counters
How would you find out that whether there is a leak in memory or pinned object count , monitor CG counters when the application in running on the device ?
The best way to monitor these counters is to use the Remote Process Monitor RPM and hook it up with the process monitor (Processmon) , follow the below steps to configure the RPM and counters to hook it to your device.
Step 0 : Connect the device to your dev box, through active sync or TCP.
Step 1 : Make sure the executable is available in the following location "C:\Program Files\Microsoft.NET\SDK\CompactFramework\v3.5\bin\NetCFRPM.exe"
I personally prefer the earlier version of RPM which does not crash like the later "C:\Program Files\Microsoft.NET\SDK\CompactFramework\v2.0\bin\NetCFRPM.exe" and hence would continue the show using v2.0 , the option are pretty much the same , feel that 2.0 is more stable than 3.5 RPM.
Note C:\ => Change the drive letter to the one you have installed it on.
Step 2 : Copy the files netcflaunch.exe & netcfrtl.dll from location "C:\Program Files\Microsoft.NET\SDK\CompactFramework\v2.0\WindowsCE\wce500\armv4i" on to the Windows directory of the device (my case it is a ARM, take the files from mipsiv if its a MIP based as all types are available)
Step 3 : Run the exe and add live counter by clicking on Live counters as shown below

Step 4 : Connect to the device and specify the location and name of the exe and connect , make sure the application is currently not running on the device as the RPM will automatically invoke the exe specified (as by default launch on connect option will be enabled).

Step 5 : Make sure the below shown option are selected for the RPM to publish the metrics to the process monitor

Step 6 : To save a stat of log file make sure the options are selected from the device menu , so that
the artifacts can be used to compare the counters after making any performance tuning.

Step 7 : Now open the performance monitor (Win Key + R -> type -> perfmon - > enter) and add the necessary counters as shown below

Once you have done all the above settings , now you are ready will all required ammunition to have a crack at the performance of your application in the device, as a result of this exercise you will have the performance graphs as well as the RPM counters which looks like this


The reports should give you a clear idea about memory , windows forms and GC details in depth which would help in identifying any bottleneck in the application , running many runs with different set of data and analyzing the data would give a clearer picture on the performance. hope this post helps you in setting up RPM and set the performance monitoring rolling. more on the counters and performance tuning best practices will follow in the future posts on the same topic. until then happy profiling.